Reporting & Analytics
Analytics that reveal
what’s slowing you down.
Turn scattered reports into structured, trackable, and actionable tickets.

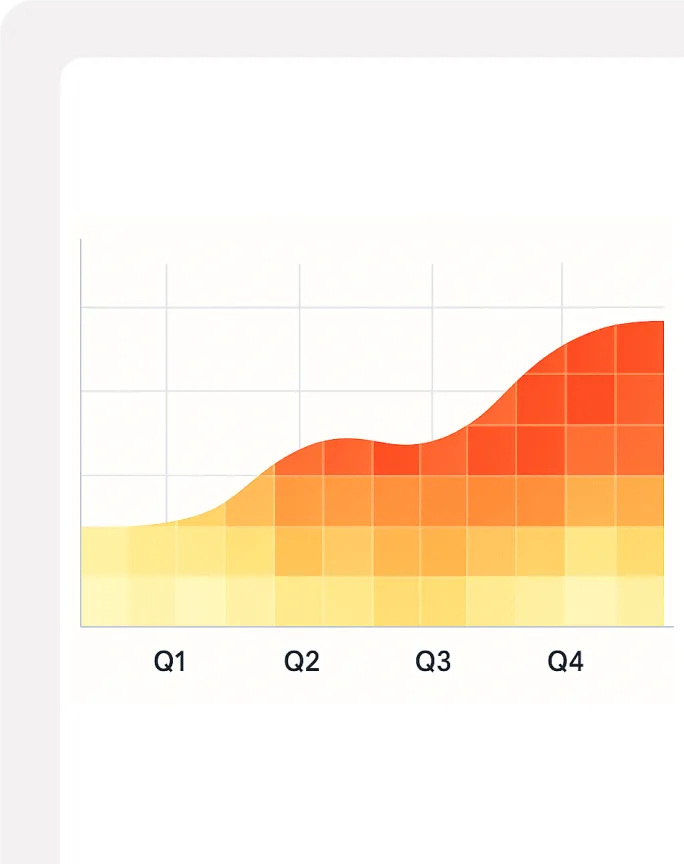
Throughput & Performance
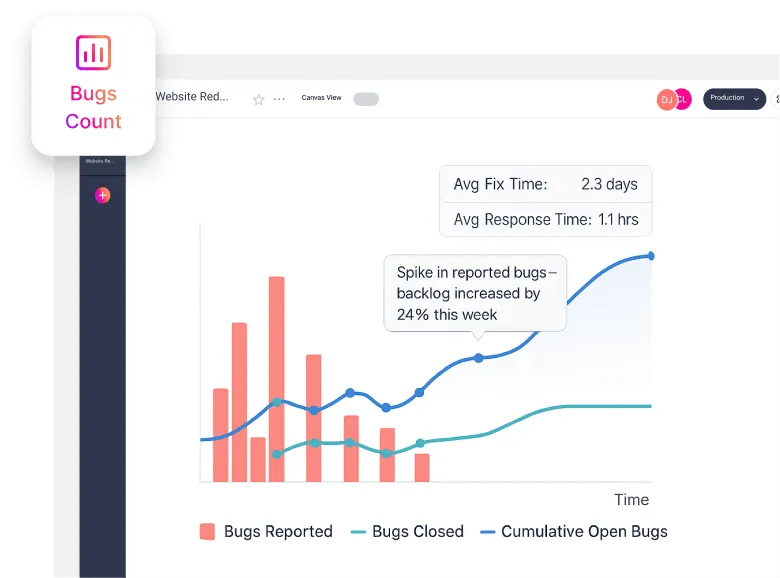
See how fast your team is responding and fixing.
Monitor bug inflow vs. bug resolution over time to pinpoint workload spikes and slowdowns.
Reported vs. Closed vs. Open Bugs
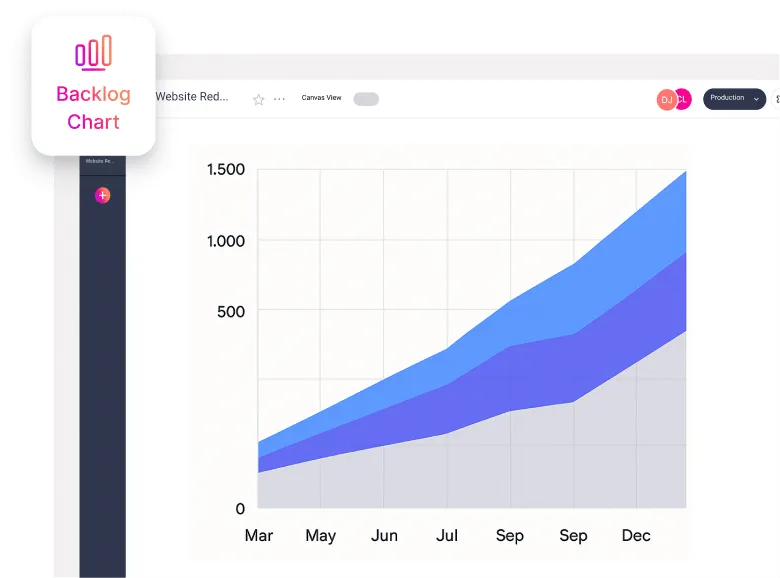
Cumulative Backlog Charts
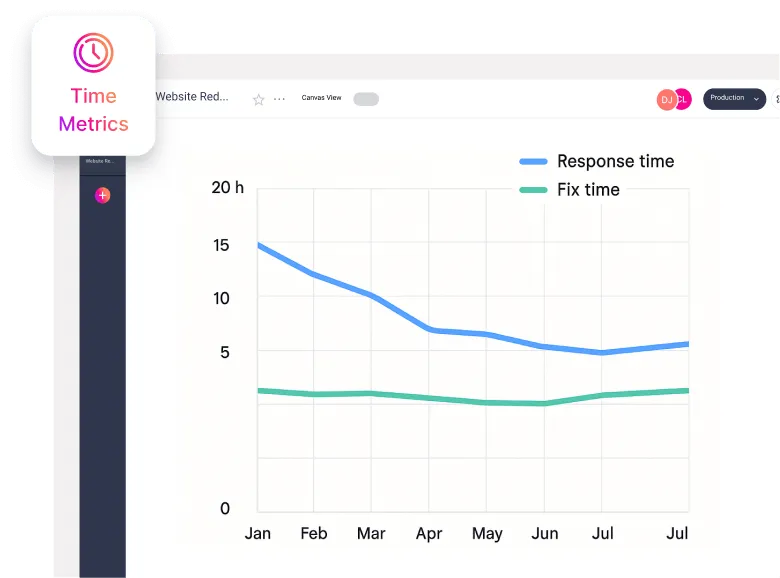
Response time and fix time metrics
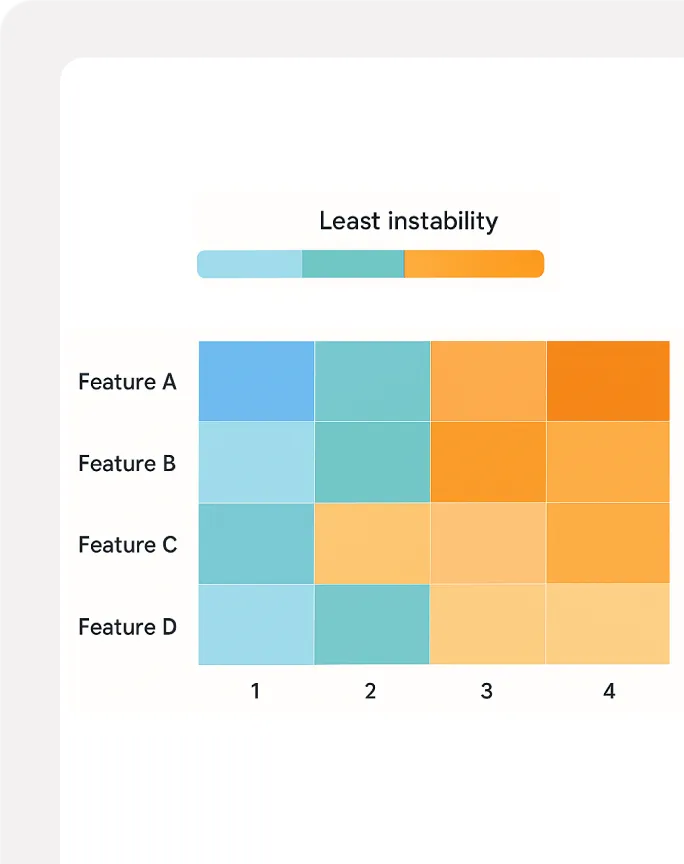
Component Heatmaps
Know which features cause the most instability.
Visualize which parts of your product generate the most bugs so you can plan improvements effectively.
Feature-level Heatmaps
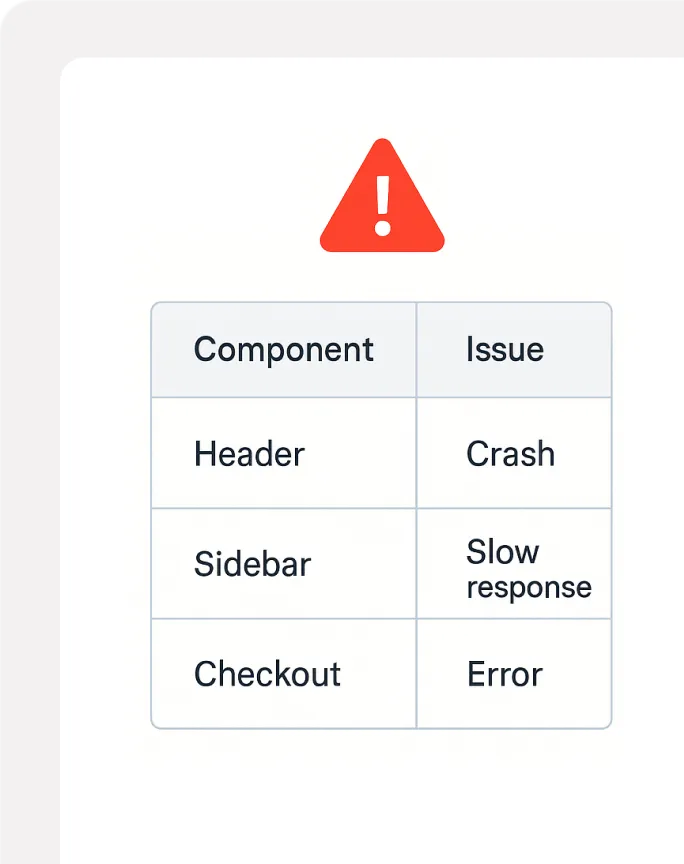
High-impact Component Alerts
Hotspot Tracking Over Time
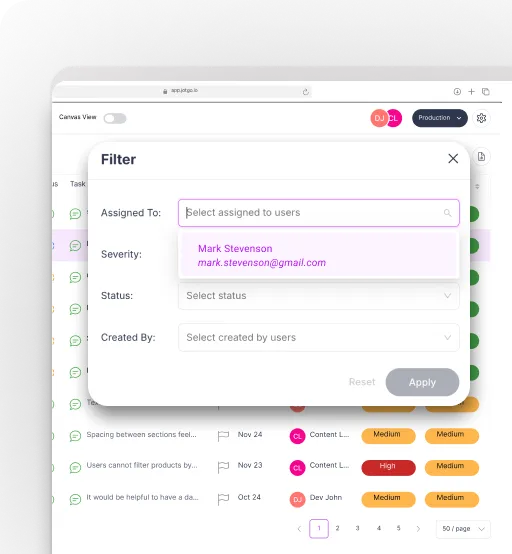
Custom Dashboards
Build dashboards tailored to your workflow.
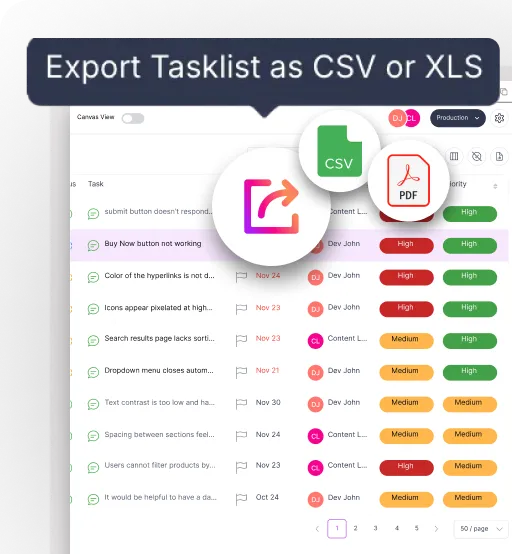
Create custom views, filters, and exportable reports that match your team’s needs.
Advanced Filters
Custom Widgets
CSV/PDF Export
Workspace-level Reporting