
Spot patterns before they become problems.
Bug volume trends, team velocity, feedback clustering - metrics that help you ship reliably.
Feature Walkthrough
Key capabilities of Insights & Analytics
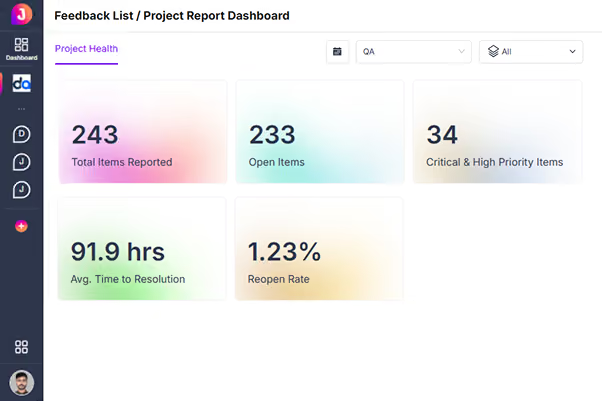
Real-Time Bug Health
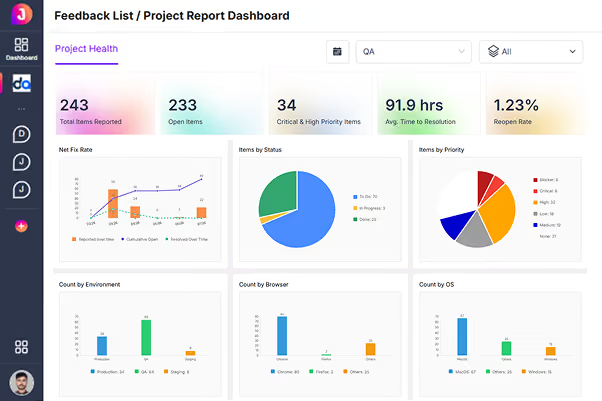
Get live visibility into bug status, priorities, and overall project health from a single dashboard. See what is open, what is critical, and where things are trending at any moment. There is no waiting for a weekly report to know where you stand.
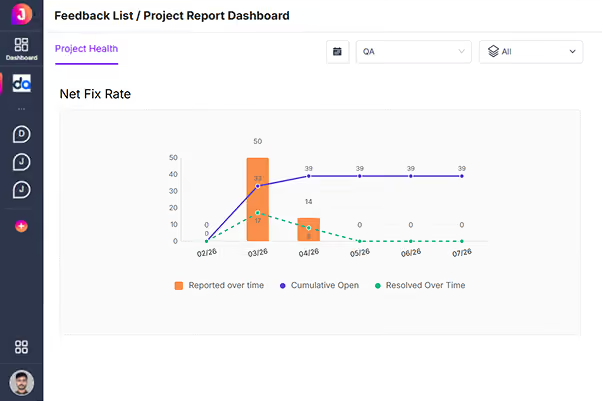
Resolution Analytics
Measure bug turnaround time and team efficiency with clear, objective metrics. Understand how long issues take to move from reported to resolved and where the delays are. Use the data to remove bottlenecks and steadily speed up your team.
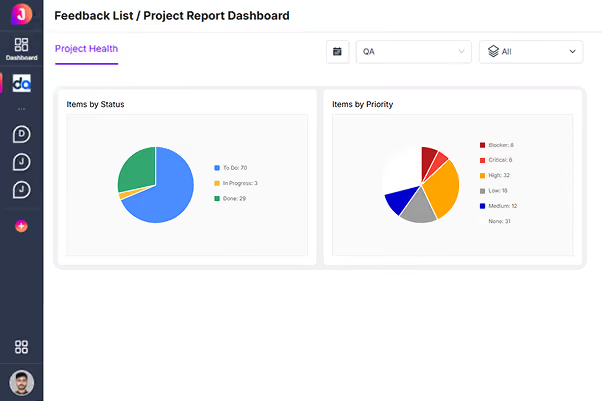
Project & Team Insights
Slice issues by project, assignee, environment, browser, and device to see exactly where problems concentrate. Spot the flaky browser or the overloaded teammate before it becomes a pattern. Every view is one filter away, no spreadsheets required.
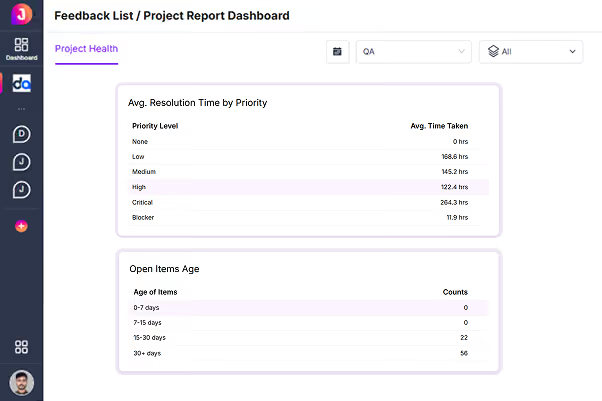
Release Readiness
Identify blockers and evaluate release quality before you ship, not after. See open criticals, unresolved regressions, and risk at a glance so go/no-go calls are grounded in data. Ship with confidence instead of crossed fingers.
Trend Reporting
Visualize bug and feedback trends across projects with interactive charts and dashboards. Monitor reporting patterns, issue distribution, and resolution progress to improve product quality continuously.
Ready to try Insights & Analytics?
Join thousands of teams who resolve bugs faster with JotGo.